링크 : http://java.ihoney.pe.kr/277


'IDE/Tool > IntelliJ IDEA' 카테고리의 다른 글

[IntelliJ IDEA] IDETalk 사용하기  (0) 2013.08.29
[IntelliJ IDEA] 단축키, 사용법(?)  (0) 2013.07.21
[IntelliJ IDEA] 한글깨짐현상  (0) 2013.07.17
[IntelliJ IDEA] IntelliJ 시작하기  (0) 2013.07.01
[IntelliJ IDEA] Tutorial  (0) 2013.06.20
posted by 뚱2

Eclipse Indigo 3.7.1 + Tomcat 7.0.25 + 스프링 MVC + Maven 3.0.4 개발 환경 구축 - 1장 : http://springmvc.egloos.com/429363

Eclipse Indigo 3.7.1 + Tomcat 7.0.25 + 스프링 MVC + Maven 3.0.4 개발 환경 구축 - 2장 : http://springmvc.egloos.com/429570

Eclipse Indigo 3.7.1 + Tomcat 7.0.25 + 스프링 MVC + Maven 3.0.4 개발 환경 구축 - 3장 : http://springmvc.egloos.com/429779

이클립스에서 SpringMVC 테스트(JUnit) 환경 구축 : http://springmvc.egloos.com/438345


posted by 뚱2

링크 : http://h5bak.tistory.com/177


posted by 뚱2

링크 : http://www.hoons.net/Board/CSHAPTIP/Content/59030


posted by 뚱2

인텔리J 시작하기 Part1 (Getting Start IntelliJ) -기본 설정편-

http://beyondj2ee.wordpress.com/2013/06/01/%EC%9D%B8%ED%85%94%EB%A6%ACj-%EC%8B%9C%EC%9E%91%ED%95%98%EA%B8%B0-part1-getting-start-intellij-%EA%B8%B0%EB%B3%B8-%EC%84%A4%EC%A0%95%ED%8E%B8/


인텔리J 시작하기 Part2 (Getting Start IntelliJ) -자바 프로젝트편-

http://beyondj2ee.wordpress.com/2013/06/15/%EC%9D%B8%ED%85%94%EB%A6%ACj-%EC%8B%9C%EC%9E%91%ED%95%98%EA%B8%B0-part2-getting-start-intellij-%EC%9E%90%EB%B0%94-%ED%94%84%EB%A1%9C%EC%A0%9D%ED%8A%B8%ED%8E%B8/


인텔리J 시작하기 Part3 (Getting Start IntelliJ) – SVN -

: http://beyondj2ee.wordpress.com/2013/06/23/%EC%9D%B8%ED%85%94%EB%A6%ACj-%EC%8B%9C%EC%9E%91%ED%95%98%EA%B8%B0-part3-getting-start-intellij-svn/


인텔리J 시작하기 Part4 (Getting Start IntelliJ) – Git -

: http://beyondj2ee.wordpress.com/2013/06/28/%ec%9d%b8%ed%85%94%eb%a6%acj-%ec%8b%9c%ec%9e%91%ed%95%98%ea%b8%b0-part4-getting-start-intellij-git/

posted by 뚱2

링크 : http://wiki.jetbrains.net/intellij/Creating_and_running_your_first_Java_application 

'IDE/Tool > IntelliJ IDEA' 카테고리의 다른 글

[IntelliJ IDEA] 한글깨짐현상  (0) 2013.07.17
[IntelliJ IDEA] IntelliJ 시작하기  (0) 2013.07.01
[IntelliJ IDEA] Zencoding plugin  (0) 2013.05.09
[IntelliJ IDEA] Short Cut  (0) 2013.05.09
[IntelliJ IDEA] VCS 연결하기 (SVN)  (0) 2013.01.05
posted by 뚱2

출처 : http://www.codeproject.com/Articles/309781/Advanced-Debugging-in-Visual-Studio


Download AdvancedDebugging.zip - 28.2 KB (Visual Studio 2010 Solution)

Introduction

Many of us developers do not look beyond the basic F9, F10, F11, F5 and Watch windows while debugging in Visual Studio. Due to this we end up wasting hours debugging an issue or simulating a condition which ideally could have been achieved in a matter of minutes if we utilized the rich debugging features available out of the box in Visual Studio.

Advanced debugging tips are scattered all over the web but I thought that a consolidated list would be very useful for developers to embrace and start using the techniques.

Environment

The tips in this article should work in Visual Studio 2008/ 2010. Many of these might still be valid for the next version of Visual Studio.

Tip List

To make going through this article easier, I am breaking it into six different tips which I will present with the help of sample code and screenshots.

1. Magic of "Make Object Id"

2. Attach to process - using macro

3. Immediate Window
- Calling functions directly
- Setting and Displaying variables

4. Debugging a Windows Service

5. Having fun with breakpoints
- Trace Points
- Condition
- Hit Count
- Filter
- Changing breakpoint location

6. Locals/Auto/ Call Stack

Bonus Tip!
Enable Sound when Breakpoint is hit

1. Magic of “Make Object Id”

Sometimes we want to track an object even after it went out of the scope. We may need this ability to debug an issue which requires us to track the object until it is garbage collected. This ability is provided with the Object Id feature in Visual Studio debugger. Follow the below steps to try it yourself.

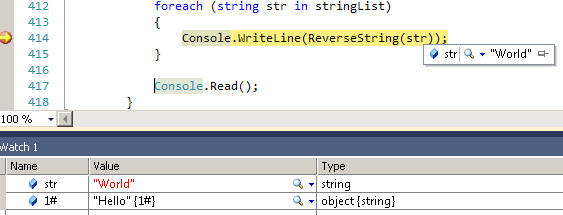
  1. Set a Breakpoint on a line of code which uses a variable your want to track as shown below.

image001.png

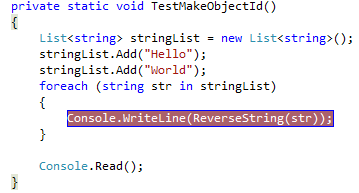
  1. Run your application in debug mode and let it stop at the Breakpoint.
  2. Right Click on str and click Add Watch.
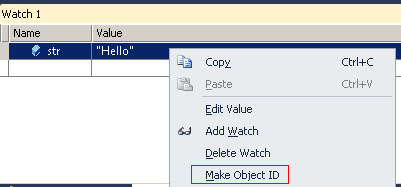
  3. In your Watch 1 window, right-click the object variable str and choose "Make Object Id" from the context menu.
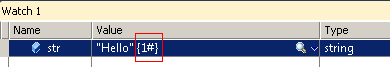
    image003.png

  4. You will now see 1# appended in the Value column. This is the unique ID given by the debugger to your variable for the current debug session.

    image005.png

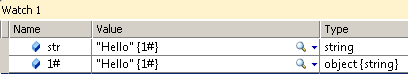
  1. We can track the object value using this ID even after str goes out of scope as shown below. Simply put the object id 1# in the watch window to watch its value.

image007.png

  1. If we continue the iteration of for loop str changes its value but 1# remains the same. This tells us that although the previous str object has gone out of scope we can still keep track of its value using the Object Id that we assigned to it.

image009.png

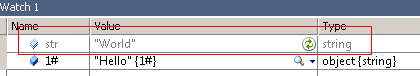
  1. Lastly if you move out of the function then all instances of str would go out of scope and you would no longer be able to track str using the Watch window. It gets grayed out. However the Object Id 1# is still active and you can continue to track its value as you move through other functions.

image011.png

Note: As the name suggests, this works only with reference and not value types. Makes sense as value types will get stored on the stack and will get popped out as soon as the scope ends. So they would ideally not depend the Garbage Collector to get cleaned up.

2. Attach to process – using macro

There are many tasks that we do in Visual Studio that are repetitive and which can be automated using macros. One such example is attaching to process for debugging. Having the ability to debug an existing running process (Ex: Process of a .net console application exe) is a common requirement. The usual way would be using the Attach To Process window from Debug -> Attach To Process in Visual Studio. But this can become cumbersome and irritating if we have to do it again and again to test iterative changes. This is where macros come to our rescue.

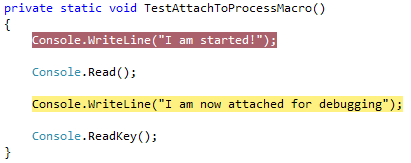
1. Create a simple console application with a Main method and a method TestAttachToProcessMacro shown below. Make a call to this method from the Main function.

image013.png

2. Build the console application. This will generate the exe file in the debug folder. Double click and start the application using this exe.

3. The first break point shown in the code above will not be hit (as we are not yet debugging) and you will see the below output in console window.

image015.png

4. We want to debug from the second breakpoint by attaching to this process so, Now we start recording our macro in 5 simple steps –

i. Click Record TemporaryMacro from the Tool -> Macros menu as shown below:

image017.png

ii. Recording is started. Now perform the necessary actions to attach to the process as below:

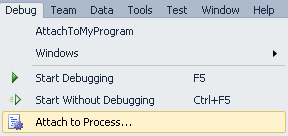
Click Debug -> Attach to Process

image019.png

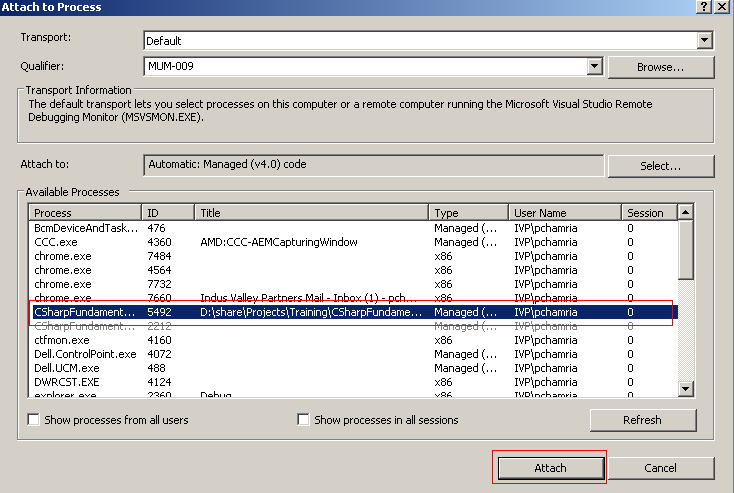
In the popup below find your process and click Attach.

image021.png

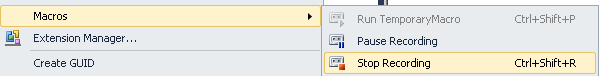
iii. Stop recording the macro using Tools -> Macros as below:
image023.png

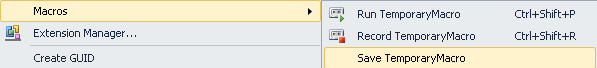
iv. Save the macro using Tools -> Macros as below:

image025.png

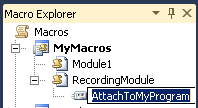
v. Upon saving, the macro will appear in the Macro Explorer. I have named it AttachToMyProgram.

image027.png

5. Lastly we can also place a shortcut to this macro on the Debug toolbar to make things even simpler.


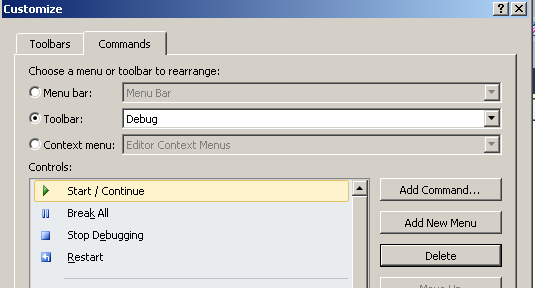
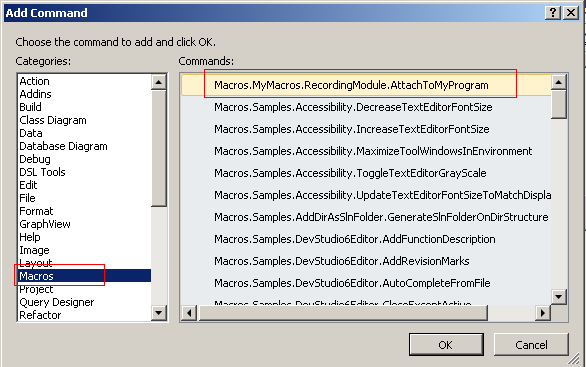
i. Go to Tools -> Customize -> Commands and under Toolbar dropdown select Debug as below:

image029.png

ii. Hit the Add Command button and on the below popup select macros under Categories and AttachToMyProgram under commands:

image031.png

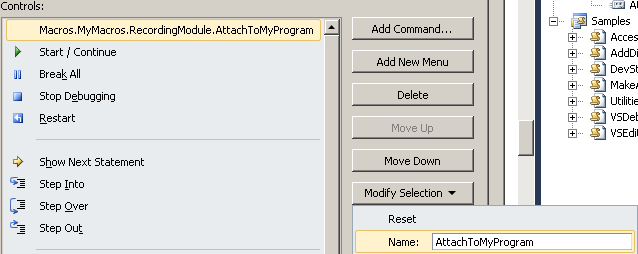
iii. Now from under the Modify Selection rename the command as shown below:

image033.png

iv. Now the AttachToMyProgram shortcut show appear in the Debug toolbar as shown below:

image035.png

6. Now close the console application and start again. We will again see the “I am started” message. Now simply hit the AttachToMyProcess shortcut on the Debug bar and press any key in the console application window. There you are! You are in the debug session and the second breakpoint is hit. Now you can easily attach to your process with a click of a button.

image037.png

3. Immediate window

So many times we write a function and wish to debug just that function directly, again and again until it gives the output we need. Many of us have been running the entire application in effort to reach that function every time we debug. Well, that’s unnecessary. This is where the Immediate window comes is handy. You can open it using the keyboard shortcut Ctrl + Alt + I.

And this is how it works:

Calling functions directly

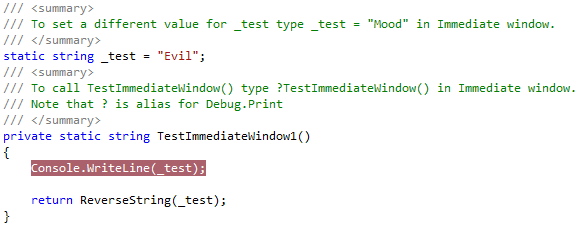
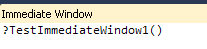
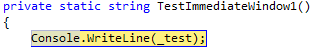
Let us try to call the below function directly from the Immediate window:

image039.png

We can call this function from Immediate window directly as below:

image041.png

Upon hitting enter in Immediate window, the breakpoint in the TestImmediateWindow1() function is hit without you having to debug the entire application.

image043.png

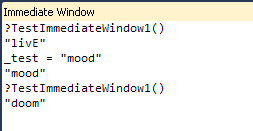
On proceeding you get the output in the Immediate window too as below:

image045.png

You can play around with the _test variable by changing its values and testing the reverse output:

image047.png

Setting & Displaying variables

We may want to pass a variable to the function we call from the Immediate window. Lets take an example of a function below:

image051.png

Using commands in the Immediate window as shown below we can declare, set and pass a variable to our function.

image049.png

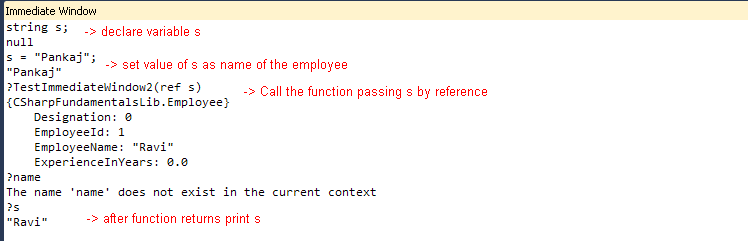
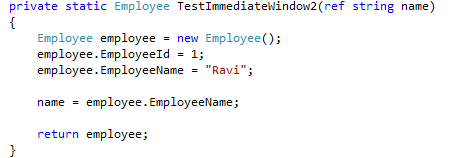
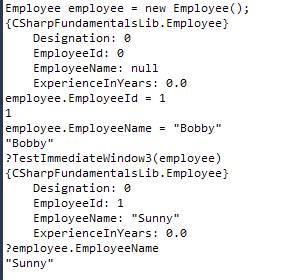
Below is yet another example to call a function passing a complex object type like object of class Employee.

image055.jpg

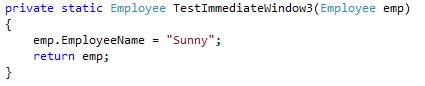
Immediate window commands to test the function:

image057.jpg

There is much more you can do with the Immediate window but I leave it up to you to explore more if interested.

4. Debugging a Windows Service

Debugging the windows service can become a daunting task if you are not aware about this tip. You would build and deploy the service and start it. Then from Visual Studio you would use Attach to Process to start debugging. Even then if you need to debug what happens in the OnStart method, then you would have to do a Thread.Sleep() or something so that the OnStart method waits for you while you attach to the process. We can avoid all the pain by this simple tip.

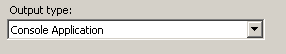
Step 1: Set the Output type of the Windows Service to Console Application:

image002.png

Step 2 : Next get rid of the Program.cs file and instead paste the below code in the Service file which inherits from ServiceBase. That’s it. Now you can run the windows service in debug and it will run as a console application. Or you can deploy as usual and it will function as a windows service.

partial class MyService : ServiceBase
    {
        public static void Main(string[] args)
        {
            /*EDIT: 18th January 2012
             * As per suggestion from Blaise in his commments I have added the Debugger.Launch condition so that you 
             * can attach a debugger to the published service when it is about to start.
             * Note: Remember to either remove this code before you release to production or 
             * do not release to production only in the 'Release' configuration.
             * Ref: http://weblogs.asp.net/paulballard/archive/2005/07/12/419175.aspx
             */

            #if DEBUG
                    System.Diagnostics.Debugger.Launch();
            #endif

            /*EDIT: 18 January 2012
            Below is Psuedo code for an alternative way suggested by RudolfHenning in his comment. However, I find 
            Debugger.Launch() a better option.
                        
            #if DEBUG
                //The following code is simply to ease attaching the debugger to the service to debug the startup routine
                DateTime startTime = DateTime.Now;
                // Waiting until debugger is attached
                while ((!Debugger.IsAttached) && ((TimeSpan)DateTime.Now.Subtract(startTime)).TotalSeconds < 20)  
                {
                    RequestAdditionalTime(1000);  // Prevents the service from timeout
                    Thread.Sleep(1000);           // Gives you time to attach the debugger
                }
                // increase as needed to prevent timeouts
                RequestAdditionalTime(5000);     // for Debugging the OnStart method <- set breakpoint here,
            #endif

            */

            var service = new MyService();

            /* The flag Environment.UserInteractive is the key here. If its true means the app is running 
             * in debug mode. So manually call the functions OnStart() and OnStop() else use the ServiceBase 
             * class to handle it.*/
            if (Environment.UserInteractive)
            {
                service.OnStart(args);
                Console.WriteLine("Press any key to stop the service..");
                Console.Read();
                service.OnStop();
            }
            else
            {
                ServiceBase.Run(service);
            }
        }

        public MyService()
        {
            InitializeComponent();
        }
        protected override void OnStart(string[] args)
        {
        }
        protected override void OnStop()
        {
        }
    } 

5. Having fun with breakpoints

You can use below variations of breakpoints in isolation or combine them together and enjoy the cocktail!

Trace Points (When Hit..)

Sometimes we want to observe the value of one or more variables each time a particular line of code is executed. Doing this by setting a normal breakpoint can be very time consuming. So we usually use Console.WriteLine to print the value. Instead if it’s a temporary check using TracePoints is better. It serves the same purpose as a Console.WriteLine would. The advantage is that you don’t have to disturb the code by adding the your Console.WriteLine and risk forgetting to remove it when done. Better still, this way you can utilize other features of breakpoint by superimposing different conditions of breakpoint on a TracePoint.

Lets see a trace point in action.

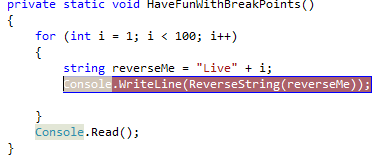
Set a break point at call to ReverseString function as shown below.

image010.png

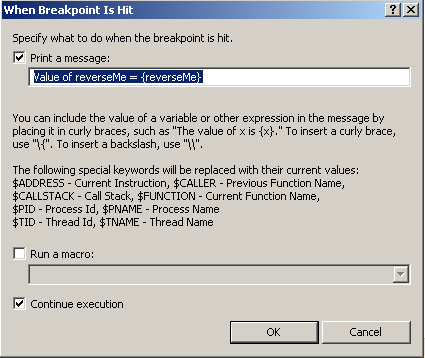
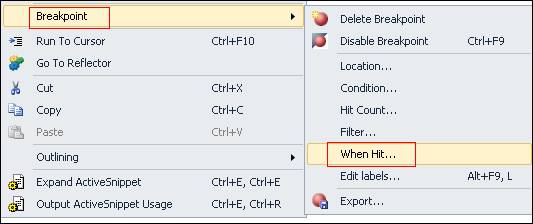
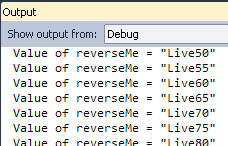
Then right click and click "When Hit.." then check Print a message. In test box copy "Value of reverseMe = {reverseMe}". Keep "Continue Execution" checked and click OK.

image077.png

image004.jpg

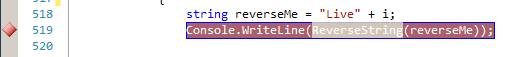
The breakpoint will get converted into a TracePoint (diamond shaped) as shown below.

image079.jpg

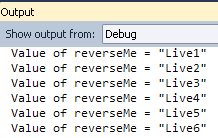
Now whenever the breakpoint is hit, it does not break in the code but continues execution and you will see the value of reverseMe variable at each hit as below in the output window:

image080.png

Condition

Condition breakpoints can be used to avoid having to write extra if/ else conditions in our code if we want a breakpoint to be hit only for a particular value.

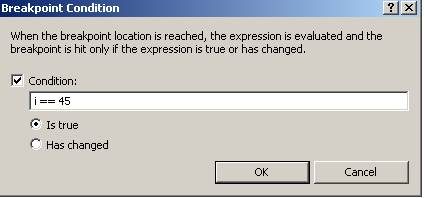
Right click the tracepoint we set above and click Condition from under Breakpoints. Then type "i==45" in condition text box & click OK. (IMP: NEVER use single "=" in condition. Always use "==".)

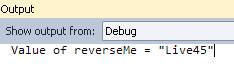
Now the breakpoint will be activated only when i = 45; so the tracepoint should print only “Live45”.

image073.jpg

image074.jpg

Hit Count

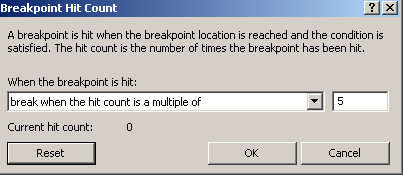
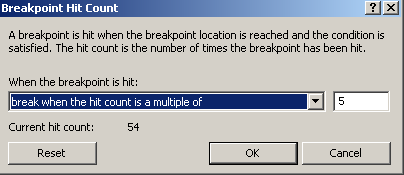
Hit count can be used to find out how many times a breakpoint is hit. Also you can choose when you want break at the breakpoint.Change the Condition breakpoint to i > 45. Then Right Click -> Breakpoint -> Hit Count. Select "break when hit count is a multiple of " and type 5 as the value. Click OK.

image075.png

Now the breakpoint will be hit after every 5 iterations. Notice below output is effect of both the Condition and the Hit Count breakpoint.

image078.png

The hit count shown below says that the breakpoint was hit 54 times between from i = 46 to i = 99, but it broke the execution only after every 5 iterations.
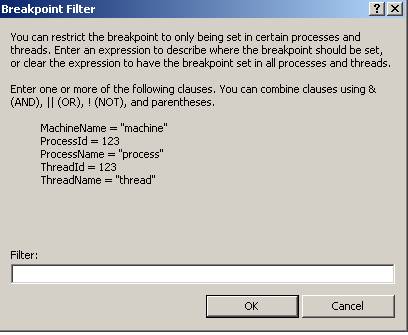
image081.png

Filter

Useful for multi threaded applications. If multiple threads are calling the same function, you can use filter to specify on which thread should the breakpoint be hit.

Right Click -> Breakpoint -> Filter

image012.jpg

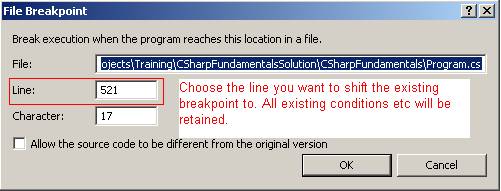
Changing Breakpoint Location

If you wish to move the breakpoint to a different line then use this option.

image082.jpg

6. Locals/ Autos/ Call Stack

The following three windows can come in handy while debugging. You can access them after you start debugging. Go to Debug -> Windows in the Visual Studio menu bar.

AUTOS: The Autos window displays variables used in the current statement and the previous statement. Helps you concentrate only on the variables being used in and around the current line.

(For Visual Basic.Net, it displays variables in the current statement and three statements on either side of the current statement.)

LOCALS: The Locals window displays variables local to the current context. You can observe values of local variables in a function here. Note that class level variable will not be visible under locals.

CALL STACK: The Call Stack displays the entire tree of function calls leading to the current function call. Can help you trace back the culprit!

Bonus Tip!

Enable Sound when Breakpoint is hit

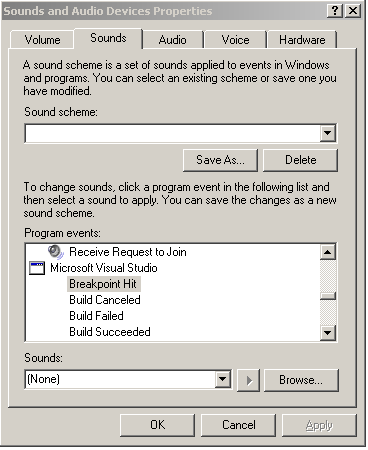
1. Go to Control Panel -> Sounds and Audio Devices (Windows XP). Its Control Panel -> Sound in Windows 7.

2. Find and Select “Breakpoint Hit” under Program events in Sounds tab. (see pic below)

3. Choose the sound of your choice and click OK.

4. Now when a breakpoint is hit, you will hear the sound!

image006.png

History

  • 18th January 2012: Incorporated Blaise's suggestion to add Debugger.Launch() option in Tip no. 4.
  • 23rd January 2012: Added a note at the end of tip 1 - Make Object Id; as per suggestion by Shivprasad Koirala.

License

This article, along with any associated source code and files, is licensed under The Code Project Open License (CPOL)

posted by 뚱2

링크 : https://code.google.com/p/zen-coding/downloads/list 


소스가 Deprecated 되었네요.

혹 IntelliJ IDEA에서 Zencoding 사용할수 있는 다른 플러그인 있으면 알려주세요.


PS. 2013-11-05 추가

현재 IntelliJ 버전이 12.1.6 인데 여기에 젠코딩 플러그인이 자체 내장되어 있습니다.

그냥 사용하시면 됩니다.

'IDE/Tool > IntelliJ IDEA' 카테고리의 다른 글

[IntelliJ IDEA] IntelliJ 시작하기  (0) 2013.07.01
[IntelliJ IDEA] Tutorial  (0) 2013.06.20
[IntelliJ IDEA] Short Cut  (0) 2013.05.09
[IntelliJ IDEA] VCS 연결하기 (SVN)  (0) 2013.01.05
[IntelliJ IDEA] Eclipse FAQ  (0) 2013.01.02
posted by 뚱2

* 주석

여러줄 주석 (토글) : Ctrl + ?

한줄 주석    (토글) : Command + /


* Auto Import

Alt + Enter


posted by 뚱2


Visual Studio 설치관리자 배포 : http://msdn.microsoft.com/ko-kr/library/vstudio/2kt85ked(v=vs.100).aspx

사용자 지정 작업 만들기 : http://msdn.microsoft.com/ko-kr/library/vstudio/d9k65z2d(v=vs.100).aspx

참고 : http://styletigger.tistory.com/21


추가 : http://msdn.microsoft.com/ko-kr/library/vstudio/d9k65z2d(v=vs.100).aspx


C++로 만드는 방법 : http://www.codeproject.com/Articles/335516/Custom-Action-in-Visual-Studio-setup-projects

http://msdn.microsoft.com/en-us/library/windows/desktop/aa370134(v=vs.85).aspx


UINT __stdcall MyCustomAction(MSIHANDLE hInstall)
{
    TCHAR* szValueBuf = NULL;
    DWORD cchValueBuf = 0;
    UINT uiStat =  MsiGetProperty(hInstall, TEXT("MyProperty"), TEXT(""), &cchValueBuf);
    //cchValueBuf now contains the size of the property's string, without null termination
    if (ERROR_MORE_DATA == uiStat)
    {
        ++cchValueBuf; // add 1 for null termination
        szValueBuf = new TCHAR[cchValueBuf];
        if (szValueBuf)
        {
            uiStat = MsiGetProperty(hInstall, TEXT("MyProperty"), szValueBuf, &cchValueBuf);
        }
    }
    if (ERROR_SUCCESS != uiStat)
    {
        if (szValueBuf != NULL)
           delete[] szValueBuf;
        return ERROR_INSTALL_FAILURE;
    }

    // custom action uses MyProperty
    // ...

    delete[] szValueBuf;

    return ERROR_SUCCESS;
}

posted by 뚱2

링크 : http://stackoverflow.com/questions/5618652/publishing-failed-with-multiple-errors-eclipse 


Eclipse produces this message when a file in an Eclipse project is changed outside of Eclipse. To avoid it:

  • a) Don't change files outside of Eclipse
  • b) Refresh the workspace/project after changing files outside of Eclipse F5 or
  • c) Enable Window > Preferences > General > Workspace > Refresh Automatically

Note: in STS 2.8.1, it is "Refresh on Access"

posted by 뚱2

참고 : http://okjsp.tistory.com/1165643034 


이클립스에 프로젝트가 하나일때는 파일 검색할때 해당 프로젝트만 검색되기때문에 쉽게 됩니다.

그런데 프로젝트가 하나둘씩 늘어날때마다 검색 결과가가 여러 프로젝트에서 고르게 검색 될때가 있습니다.

이럴때는 이클립스 워킹셋을 만들어서 검색 범위를 줄일수 있습니다.


위외 같이 해당 워킹셋으로 검색 범위를 좁힐수 있습니다.


posted by 뚱2

자바 프로그래머라고 하면 대부분 웹을 지칭하는 것 같습니다.

순수 자바 프로그래머 보기 쉽지 않네요.

저는 아직 한분도 뵙지 못했습니다.


이클립스에서 자바 프로젝트로 생성시 외부 jar 파일을 포함해야 하는 경우가 있습니다.

기존 서적 대부분은 콘솔 환경에서만 다루다 보면 막상 이클립스에서 할려면 막막하더군요.


그래서 정리해봤습니다.


1. TCPMON_TEST 프로젝트를 생성한다.

2. 프로젝트에 lib폴더를 생성한다 (꼭 lib 폴더 이름으로 생성할 필요없습니다.)

3. 외부 tcpmon-1.1.jar 파일을 넣는다.

4. 프로젝트 -> Properties -> Java Build Path -> Libraries -> Add JARs... -> [클릭]

5. 임포트한 tcpmon-1.1.jar 파일을 선택한다.


posted by 뚱2

링크 : http://mytory.net/archives/1015 

링크 : http://libmarco.tistory.com/47 

링크 : http://yysvip.tistory.com/182 


* 주의사항 : 서버에 올라간호 파일을 ignore하면 안된다. 우선 서버의 동기화에서 제외할 파일을 삭제한후 적용시키면 된다.


posted by 뚱2

[Eclipse] Link With Editor

IDE/Tool/Eclipse 2013. 4. 3. 12:25

해당 파일을 선택하면 Navigator의 트리 위치가 알아서 펼쳐지는 유용한 기능


posted by 뚱2

Window -> Preferences -> General -> Content Types -> Text -> JSP -> Default-Encoding -> [변경]


posted by 뚱2

링크 : http://wiki.eclipse.org/Eclipse.ini 

참고 : http://wiki.kwonnam.pe.kr/eclipse/config 


Eclipse startup is controlled by the options in $ECLIPSE_HOME/eclipse.ini. If $ECLIPSE_HOME is not defined, the default eclipse.ini in your Eclipse installation directory (or in the case of Mac, the Eclipse.app/Contents/MacOS directory) is used.

eclipse.ini is a text file containing command-line options that are added to the command line used when Eclipse is started up. There are many options available, please see here.

Important:

  1. Each option and each argument to an option must be on its own line.
  2. All lines after -vmargs are passed as arguments to the JVM, so all arguments and options for eclipse must be specified before -vmargs (just like when you use arguments on the command-line)
  3. Any use of -vmargs on the command-line replaces all -vmargs settings in the .ini file unless --launcher.appendVmargs is specified either in the .ini file or on the command-line. (doc)


By default, eclipse.ini looks something like this (the exact contents will vary based on operating system and which Eclipse package you have):

-startup
../../../plugins/org.eclipse.equinox.launcher_1.2.0.v20110502.jar
--launcher.library
../../../plugins/org.eclipse.equinox.launcher.cocoa.macosx.x86_64_1.1.100.v20110502
-product
org.eclipse.epp.package.jee.product
--launcher.defaultAction
openFile
-showsplash
org.eclipse.platform
--launcher.XXMaxPermSize
256m
--launcher.defaultAction
openFile
-vmargs
-Dosgi.requiredJavaVersion=1.5
-XX:MaxPermSize=256m
-Xms40m
-Xmx512m

Among other things, this sets the heap space to 40MB initially and a maximum of 512MB, and also specifies a maximum PermGen size of 256MB. A max heap of 512MB might be OK for some users, but it's often necessary to bump that value up for large project sets or when some third-party plugins are installed.

Specifying the JVM

One of the most recommended options to use is to specify a specific JVM for Eclipse to run on. Doing this ensures that you are absolutely certain which JVM Eclipse will run in and insulates you from system changes that can alter the "default" JVM for your system. Many a user has been tripped up because they thought they knew what JVM would be used by default, but they thought wrong. eclipse.ini lets you be CERTAIN.

The following examples of eclipse.ini demonstrate correct usage of the -vm option.

Note the format of the -vm option - it is important to be exact:

  • The -vm option and its value (the path) must be on separate lines.
  • The value must be the full absolute or relative path to the Java executable, not just to the Java home directory.
  • The -vm option must occur before the -vmargs option, since everything after -vmargs is passed directly to the JVM.

Here is an example of what eclipse.ini might look like on a Windows system after you've added the -vm argument and increased the maximum heap space:

-startup
plugins/org.eclipse.equinox.launcher_1.2.0.v20110502.jar
--launcher.library
plugins/org.eclipse.equinox.launcher.win32.win32.x86_1.1.100.v20110502
-product
org.eclipse.epp.package.java.product
--launcher.defaultAction
openFile
--launcher.XXMaxPermSize
256M
-showsplash
org.eclipse.platform
--launcher.XXMaxPermSize
256m
--launcher.defaultAction
openFile
-vm
C:\Java\JDK\1.6\bin\javaw.exe
-vmargs
-Dosgi.requiredJavaVersion=1.5
-Xms40m
-Xmx1024m

Remember that the exact values will differ slightly depending on operating system and Eclipse package.

-vm value: Windows Example

This is how the -vm argument might look on Windows (your exact path to javaw.exe could be different, of course):

-vm
C:\Java\JDK\1.6\bin\javaw.exe 


This might not work on all systems. If you encounter "Java was started but returned exit code=1" error while starting the eclipse, modify the -vm argument to point to jvm.dll (exact path could be different):

-vm
C:\Development\Java\64bit\jdk1.7.0_09\jre\bin\server\jvm.dll

-vm value: Linux Example

This is how the -vm argument might look on Linux (your exact path to javacould be different, of course):

 -vm
/opt/sun-jdk-1.6.0.02/bin/java

-vm value: Mac OS X Example

On a Mac OS X system, you can find eclipse.ini by right-clicking (or Ctrl+click) on the Eclipse executable in Finder, choose Show Package Contents, and then locate eclipse.ini in the MacOS folder under Contents.

To specify Java 6 for OS X:

 -vm
/System/Library/Frameworks/JavaVM.framework/Versions/1.6.0/Home/bin/java

For versions of Mac OS X 10.7+ the location has changed to

/Library/Java/JavaVirtualMachines/<''jdk_name_ver''>/Contents/Home/...

To be safer, determine the location for the JDK you intend to use via the utility /usr/libexec/java_home and put this value with .../bin/java appended into the Eclipse.ini file.

posted by 뚱2

링크 : http://blogs.msdn.com/b/eva/archive/2009/03/24/visual-studio-tip-3.aspx 


posted by 뚱2

링크 : http://www.viva64.com/en/b/0169/


posted by 뚱2


posted by 뚱2

링크 : http://wiki.jetbrains.net/intellij/Eclipse_FAQ 


What happened to my Workspace? Where are all my projects?

They're OK, but in a slightly different way.

IntelliJ IDEA creates a project for the entire code base you work with, and a module for each of its individual components. So, IntelliJ IDEA module is more like an Eclipse project, and project is roughly similar to Eclipse workspace. There's no exact equivalent to Eclipse's workspace that contains all your work, but you can open multiple projects in multiple frames at the same time.

This table can help you see how Eclipse and IntelliJ IDEA concepts map to each other:

EclipseIntelliJ IDEA
A number of projects, a workspaceProject
ProjectModule
User libraryGlobal library
Classpath variablePath variable
Project dependencyModule dependency
LibraryModule library

How do I open my Eclipse projects now?

That's very easy. You have an option to either import, or link them.

IntelliJ IDEA supports Eclipse classpath module dependencies, so you can link your Eclipse projects to IntelliJ IDEA and work even in a mixed IDE team. Alternatively, you can import an Eclipse project to IntelliJ IDEA native format if you don't need any backward compatibility. If you're using Maven, you can directly open a pom.xml file and IntelliJ IDEA will import all dependencies, download the libraries if needed, and do all the setup completely.

Facets — what they are for?

To streamline the project configuration.

Facets encapsulate support for a variety of frameworks, technologies and languages. For example, to enable Spring in your project, you only have to add the corresponding facet. All libraries are downloaded and configured, you get the full range of coding assistance, refactorings, etc. Moreover, the code model is also recognized, so you are completely free from worrying about any configuration issues.

In most cases, you can add more than one facet of the same type to your project. For example, you can have multiple Web facets for deploying the application to different servers, or several EJB facets, each for its own EJB version. (See also Project Configuration and Configuring Project Structure.)

Where do I configure project JDK?

In the Project Structure dialog.

To add a JDK to project, press Ctrl+Alt+Shift+S, under Platform Settings click JDKs and specify JDK path. After that, click Project and specify which of the JDKs you have configured will be used now as the current project JDK. Remember that JDKs are configured at the IDE level, so when you create another project, you won't need to add the same JDK again.

Refer to Configuring Project SDKfor details.

How do I add files to my project?

Just copy them to the project folder. IntelliJ IDEA tracks all changes to project files and automatically takes an appropriate action.

How do I share my preferences?

Via project-level settings.

IntelliJ IDEA enables you share your code style settings, run configurations, inspection profiles, and more, by making them project-level, so that they are stored in the project description file and so are available to all team members.

You can also use settings synchronization via IntelliJ IDEA Server and take favorite settings with you to any computer where you're running IntelliJ IDEA. (See also IDE Settings Synchronization.)

How do I configure code templates ?

In IntelliJ IDEA you have Live Templates — predefined code fragments invoked by typing an associated abbreviation. They may include parameters that are used to automatically adjust them to the insertion context. Click here for more information about how to use the templates in code. To manage Live Templates, press Ctrl+Alt+S to open the Settings dialog, and under the IDE Settings, click Live Templates. (See also Code Generation.)

How do I make sure all my files are saved?

Don't worry. They are all saved automatically.

With IntelliJ IDEA you never need to worry about saving your files when you switch to another app, compile or run your code, perform a VCS operation, and so on. Refer to the section Saving and Reverting Changes for details.

For extra safety you can enable auto save after specified period of time. In case you need to roll back any unwanted changes, you can use Local History — IntelliJ IDEA built-in VCS.

What happened to incremental compilation? How do I compile my project?

It's there, but works slightly other way.

By default IntelliJ IDEA compiles files only when it's needed (when you run your app or explicily invoke the Make action), and so saves system resources for other tasks that can be more important at the moment. The compilation is incremental: IntelliJ IDEA keeps track of dependencies between source files and recompiles only if a file has been changed.

Files with compilation errors are highlighted, and so are the folders containing them — so you can easily analyze them via Project view. To see a list of all files with compilation errors, select Scope | Problemsfrom the View As combobox of the Project view. After each compilation, IntelliJ IDEA constantly performs background code analysis on files with errors, and removes the red highlighting automatically when you've fixed them.

To enable compiling files on every save, you can use the EclipseMode plugin: http://plugins.intellij.net/plugin/?id=3822 (third-party development, not bundled). To be able to run code with errors, you can select the Eclipse compiler in Settings dialog, Compiler, Java Compiler and add the -proceedOnError option to the Additional command line parameters for the compiler.

Which options are available for configuring code inspections?

With IntelliJ IDEA, you can define a set of active code inspections — a profile. IDE level profiles are available in all projects on current machine, project level profiles can be used by all team members. Here you can find some more information about inspecting the source code.

To configure inspection profiles either open the Settings dialog, or click the Hector icon in the toolbar. You can also configure inspections individually — every time a bulb pops up, telling you about a problem, press Alt+Enter, Right Arrow to open menu where you can configure or suppress this inspection for the current file or even entire project.

Where are my old favorite keyboard shortcuts?

IntelliJ IDEA includes a bundled Eclipse keymap, so you can select it in the Keymap page of the Settings dialog, if you prefer using shortcuts you're accustomed to. If you want to learn the IntelliJ IDEA keyboard shortcuts, you can read or print out the Default Keymap Reference from Help menu.

Refer to the Configuring Keyboard Shortcuts section for additional information.

I feel that the editor behaves differently. Am I right?

In Eclipse, virtual space (the possibility to place the caret after the end of a line) is disabled by default, which is contrary to IntelliJ IDEA default setting. To alter it, go to the Editor page of the Settings dialog, and clear the Allow placement of caret after end of line option.

By default, Eclipse highlights the usages of the identifier at caret. To enable this behavior in IntelliJ IDEA, select the option Highlight usages of element at caret on in the same place as above.

Also note that there's a maximum number of editor tabs (adjustable via Settings dialog), so if you are opening a new file when a maximum number of editors is already reached, the oldest one will be automatically closed.

Why are there three ways to invoke Code Completion?

In IntelliJ IDEA you have three types of completion, that work differently so that you can always pick what's best for the code you're working with.

For example, when you just need to quickly complete an obvious statement, you can press Ctrl+Space and it's done. It's called Basic Completion. It also comes in handy when you want to look at the complete list of available choices in the current context, or need to complete a keyword.

If you need more precision and don't want to scroll through an endless list of selections, use Ctrl+Shift+Space to narrow the selection down by the expression type. Smart Completion that is invoked this way, will filter the list for you, letting you get what you need quicker. Moreover, if you press it once again it will even show you the symbols that can be reached through a chained method call.

Finally, the Class Names Completion (Ctrl+Alt+Space) lets you quickly complete a class name, and insert an import statement if it's not referenced yet.

(See also Intelligent Coding Assistance.)

How do I configure VCS integrations? How do I add my project to VCS?

In IntelliJ IDEA you first configure a VCS by selecting its type and specifying the connection settings like server name and access credentials, and then map project folders to VCS you have configured.

To put a project under version control, simply map its root folder to the VCS you are using.

Refer to the section Enabling Version Control for details.

How do I work with VCS? Where to inspect the diffs?

In Eclipse you have Sync perspective that shows the difference between your local version of the code and that of VCS server. In IntelliJ IDEA this functionality is a small part of the Changes tool window, where the Local tab shows the changes you've done locally, the Incoming tab shows the changes that were checked in to the VCS server by other team members and not yet synced, and so on.

To learn how to work with differences in IntelliJ IDEA, refer to the section Handling Differences.

How do I check out a project from VCS?

It's the easiest way of creating a project from sources that you're checking out from VCS. Just click Check out from Version Control.

posted by 뚱2

링크 : http://wiki.jetbrains.net/intellij/Creating_a_simple_Web_application_and_deploying_it_to_Tomcat 

posted by 뚱2

출처 : http://tanu.wordpress.com/2010/09/24/moving-from-eclipse-to-intellij-idea/


Moving from Eclipse to Intellij Idea

Initial Struggle:

I have been Eclipse user for almost 2+ years. Suddenly one day i stumbled upon intellij idea. Courtesy of my team mates.

Initially moving from Eclipse to Idea was overwhelming. Neither i had patience nor time to learn new IDE with its own set of shortcuts.
Still after lotta of good reviews about it, decided to give it a try. Well at first i failed at it. The reason i was still using eclipse as primary IDE, since Idea shortcuts were completely different than eclipse and they were quite strange that time.

Somehow decided to give it one more shot, and this time it did click with me. I struggled initally but survived. Believe me its worth the struggle. It surely is a most intelligent IDE, especially if you are working with Javascript. Eclipse has worst Javascript support and its pain. I know there are plugins for it, but they are useless.

Idea Ninja:

No one can use IDE efficiently without mastering the shortcuts. Idea has excellent reference for shortcuts. I suggest you look into the complete idea keymap from here

If you are eclipse user, here is the small idea keymap with corresponding eclipse shortcuts.

ActionEclilpseIdea
Code CompletionCtrl + SpaceCtrl + Space 

Ctrl + Shift + Space

Ctrl + Alt + Space

Reformat codeCtrl+Shift+FCtrl + Alt + L
Optimize importsCtrl + Shift+ OCtrl + Alt + O
Delete line at caretCtrl+DCtrl + Y
ReplaceCtrl + FCtrl + R
Find in pathCtrl+HCtrl + Shift + F
Replace in pathCtrl + Shift + R
Step overF6F8
Step intoF5F7
Step outF7Shift + F8
Resume programF8F9
View breakpointsDebug ViewCtrl + Shift + F8
Go to classCtrl + Shift + TCtrl + N
Go to fileCtrl + Shift + RCtrl + Shift + N
Go to lineCtrl+LCtrl + G
Recent files popupCtrl + ECtrl + E
Go to declarationCtrl + Click or F3Ctrl + B or Ctrl + Click
Go to implementation(s)Ctrl+TCtrl + Alt + B
Type hierarchyF4Ctrl + H
Show usagesCtrl + Shift+GCtrl + Alt + F7
Generate code… (Getters, Setters, Constructors, 

hashCode/equals, toString)

Alt + InsertAlt + Shift+S

Tips:

1. Learn to use Ctrl+J
Ctrl+J brings up the Live Template options based on where your cursor is. If you’re in Javadoc then there will be some Javadoc intentions, if you have code highlighted then there will be some surround intentions.

2. Learn to use Ctrl+Alt+T
Highlighting code and pressing Ctrl+Alt+T will bring up the “Surround With” menu.

3. Increase Your Heap Size
IDEA critics (rightly, in my experience) complain that it is slower than Eclipse. Well, your first step should be to increase the heap size. Locate your idea.exe.vmoptions file and open it with a text editer (IDEA works fine). My file is in C:\Program Files\JetBrains\IntelliJ IDEA 7.0.2\bin. Change the -Xmx line to allow a bigger heap. Mine is set at -Xmx512m.

posted by 뚱2

링크 : http://www.jetbrains.com/idea/webhelp/intellij-idea.html 

posted by 뚱2

링크 : http://www.jetbrains.com/idea/webhelp/adding-deleting-and-moving-lines.html 


라인 복사 : Command + D

라인 삭제 : Command + Y

라인 위로 이동 : Alt + Shift + Up

라인 아래로 이동 : Alt + Shift + Down


To add a line
  • Press Shift Enter to add a new line after the one where the caret is currently located and move the caret to the beginning of this new line.

    For instance, you have typed some text:

    shiftEnter1.gif

    Press Shift Enter to start the next line immediately:

    shiftEnter2

To duplicate a line or fragment
  1. Place the caret at the line to be duplicated, or select the desired fragment of text.
  2. Press Command D.
To remove a line
  • Press Command Y to delete the line at caret.
To move a line
  1. Place the caret at the line to be moved.
  2. Do one of the following:
    • On the main menu, choose Code | Move Line Up or Code | Move Line Down.
    • Press Alt Shift Up or Alt Shift Down.

    IntelliJ IDEA moves the selected line one line up or down, performing the syntax check. For example:

    moveLine1

    After moving line at caret:

    moveLine2

posted by 뚱2
IntelliJ IDEA 12부터 가능합니다.

Preferences -> IDE Settings -> Appearance -> Theme -> Darcula 선택


posted by 뚱2

Preferences -> Editor -> Appearance -> Show line numbers 체크


posted by 뚱2

프로젝트가 2개 이상 존재해야 Open Recent 목록이 활성화 된다.


posted by 뚱2

프로그램을 개발하다 보면은 툴에 익숙지 않아서 은근히 시간을 잡아 먹는 경우가 있다.


VC++을 하다가 Java를 할때 답답했던 첫번째는 많은 import를 어떻게 해야 하나 였다.


물론 이클립스에서 CTRL+SHIFT+O라는 환상의 단축키가 있다.


이런 비슷한게 C#에서 using문인데 찾아보니 위에것 정도 되는건 아니지만


고를수 있게 나오는 정도는 된다.


단축키는 CTRL+. 이다.


필요한 클래스에 커서를 놓고 'CTRL + .' 을 누르면 위에 이미지와 같이 인텔리센스 기능이 된다. 선택후 Enter 하면은 자동 포함 된다.

posted by 뚱2

링크 : http://msdn.microsoft.com/ko-kr/vstudio/vextend/

링크 : http://msdn.microsoft.com/ko-kr/library/dd885119(v=vs.100).aspx 

posted by 뚱2